
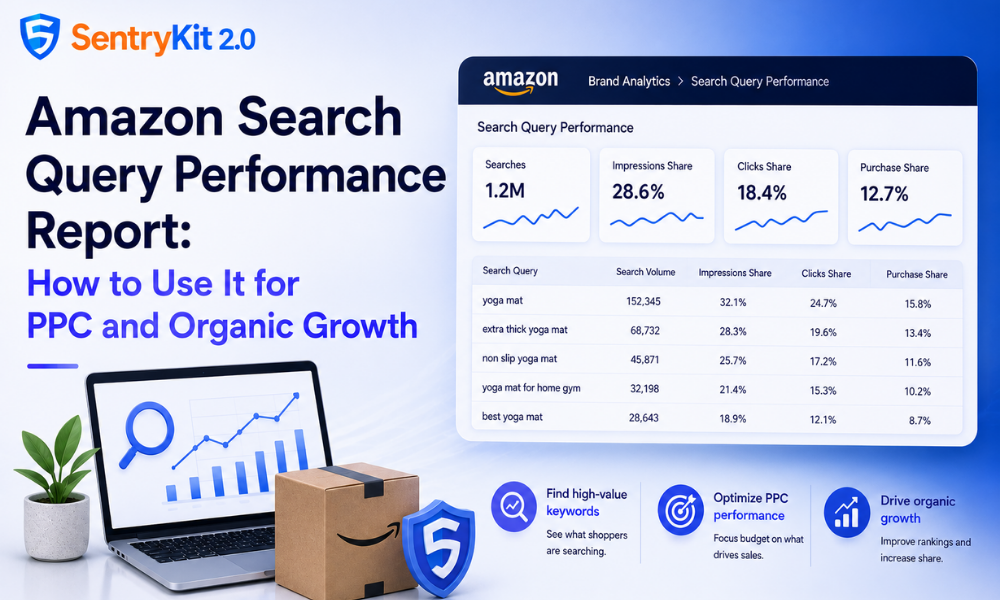
The Search Query Performance (SQP) report in Amazon Brand Analytics is one of the most underused tools available to Brand Registry sellers. It shows you exactly which search terms are driving impressions, clicks, and purchases for your ASINs — along with how your share of those metrics compares to the overall market. Most sellers glance at it once and move on. The sellers getting the most value from it check it regularly and use it to make specific decisions about which keywords to bid on, where to cut spend, and when their listing position has slipped.
This post breaks down what the report actually shows, where to find it, and how to translate the data into concrete PPC and organic actions.
The SQP report gives you a view of search performance at the keyword level. For each search query where your products appeared, it shows:
This isn’t PPC data — it’s organic + paid blended together, covering all placements. So it reflects your total visibility for a given search term, not just your ad performance. That distinction matters when you’re trying to understand whether a share decline is a PPC coverage problem, an organic ranking problem, or a listing conversion problem.
The SQP report is available at the brand level and at the individual ASIN level, and you can filter by ASIN to see which specific products are driving performance for each query. You can also select different time windows: weekly, monthly, and quarterly. Quarterly data is most useful for spotting sustained trends; weekly data helps you respond to short-term shifts.
The Search Query Performance report lives inside Amazon Brand Analytics, which is accessible only to Brand Registry enrolled sellers. The path in Seller Central is:
Brands → Brand Analytics → Search Query Performance
You’ll need to select a reporting period and can filter by ASIN or view all products for your brand. The data is typically available with a 2–4 week lag — so the most recent complete data you’ll see in early July covers mid-to-late June. Keep that lag in mind when making decisions based on the report; you’re looking at what happened, not what’s happening right now.
The report exports cleanly to Excel or CSV, which makes it much easier to sort, filter, and cross-reference against your PPC data from Advertising Console. Most of the useful analysis happens in a spreadsheet, not in the Brand Analytics interface directly.
If you have multiple ASINs in the same category, running separate ASIN-level reports for your top performers is worth the extra time. The brand-level report aggregates everything, which can mask poor performance on individual listings that have strong category-level averages.
The report has several columns, but there are four metrics that drive most of the useful decisions:
1. Search Query Volume
This tells you how much demand exists for a given term. High-volume terms are competitive and expensive to rank for; low-to-mid volume terms with strong purchase rates often represent the most accessible opportunity. Use this column to separate your priority keywords from background noise.
2. Click Share
Click share is your percentage of total clicks for that query. A high click share relative to your impression share means your listing is converting well from search to click — your title, main image, and price are doing their job. A low click share relative to your impression share means you’re showing up but shoppers aren’t clicking — usually a sign of a weak main image or a title that doesn’t connect with search intent.
3. Purchase Share
This is the most direct signal of actual sales performance for a given keyword. It shows what percentage of total purchases made after a search for that term came from your brand. A high purchase share on a term where you have low click share means your product converts extremely well once customers land on it — which is a strong signal to drive more traffic to that keyword. A low purchase share despite high click share is a listing conversion problem: customers are clicking but not buying.
4. Your Rank
Some sellers export the data and sort by purchase share descending to find their strongest performing keywords, then cross-reference those against their active PPC campaigns. If a keyword is generating a significant share of purchases but isn’t in your campaigns, that’s a high-value omission. If it’s in your campaigns with heavy spend but your purchase share is low, you may be funding traffic that’s not converting.
The most practical use of the SQP report for most sellers is keyword gap analysis: finding terms where you have purchase intent but insufficient ad coverage.
High purchase share, low impression share: You’re winning sales when you show up, but you’re not showing up consistently. This is typically an organic ranking or bid coverage gap — add the keyword to your sponsored products campaigns, or increase bids if it’s already in a campaign. These terms are often your most efficient PPC targets because purchase intent is already proven.
High impression share, low click share: You’re visible but not compelling. The problem is usually the creative: main image, price, or review count relative to competitors. Fixing this is a listing problem before it’s a PPC problem — more spend on a weak listing will give you more impressions of a weak offer.
High click share, low purchase share: Traffic is coming in but not converting. Check your detail page against competitor listings ranking for the same term — is your price competitive? Are your bullet points addressing the same intent as the search query? Is your review score dragging conversion? This is the classic case where driving more PPC traffic makes the problem worse, not better.
A useful exercise: pull 90-day SQP data, sort by purchase share, and identify the top 25 terms driving purchases for your brand. Cross-reference those 25 terms against your active PPC campaigns. Any term in the top 25 that isn’t in your campaigns is likely driving organic sales already — adding it to PPC with a conservative bid lets you capture the paid placement on top of organic, doubling your surface area without cannibalizing organic performance.
Period-over-period drops in click share or purchase share are the most actionable signals the SQP report provides. When a term where you previously held strong share starts declining, one of a few things is happening:
The SQP report shows you that the decline happened. It doesn’t always tell you why. That’s where you need to combine it with other data sources: check your Buy Box win rate in Seller Central for the relevant ASINs, review your organic ranking for the affected keywords using the Search Term Report from Advertising Console, and look at whether new sellers have appeared on your listing.
Buy Box changes are particularly easy to miss because the SQP report aggregates data over periods. A few days of Buy Box loss in a 30-day window can meaningfully reduce your monthly purchase share for affected keywords, but you won’t see it as an event in the SQP data — just as a number that’s lower than last month. Real-time Buy Box monitoring catches those events as they happen, so you’re not waiting 30 days to discover that a competitor or unauthorized seller has been capturing your purchase share since mid-month.
When you identify a purchase share drop, the remediation sequence is: first confirm whether it’s a Buy Box issue, then check organic rank, then evaluate your PPC coverage. Throwing more ad spend at a term where you’ve lost the Buy Box won’t recover purchase share — you need to win the Buy Box back first. SentryKit’s Buy Box alerts fire the moment you lose the Buy Box on a monitored ASIN, which means you can address the underlying cause within minutes rather than discovering it weeks later through the SQP report lag.
The Search Query Performance report is available to sellers enrolled in Amazon Brand Registry. It is not available to sellers without a registered trademark and Brand Registry enrollment. You access it through Seller Central under Brands → Brand Analytics.
Amazon typically updates the Search Query Performance report weekly, but the data has a 2–4 week lag. The most recent complete reporting period is usually 2–3 weeks behind the current date. Amazon does not provide real-time keyword performance data in Brand Analytics.
Impression share is what percentage of the total times shoppers saw a search result for that query your listing appeared. Click share is your percentage of total clicks from that search result page. Purchase share is your percentage of total purchases made after searching that term. Purchase share is the most direct measure of your actual sales performance for a keyword.
The SQP report shows your own brand’s data, not competitors’ data. However, since the report shows total search query volume and your share of impressions, clicks, and purchases, you can infer that the remainder of those metrics belongs to competitors. Terms where you have low share but high volume represent markets where other brands are winning — and potential opportunities for you.
Click share can drop when competitors increase their bids, improve their listings, or when your organic ranking for that term slips. It can also drop if you’ve lost the Buy Box on your listing — even if your product appears in search, shoppers clicking through may land on a different seller’s offer, which affects conversion and can lower click attribution to your brand.

Nisha Shetty · Marketing Manager, SentryKit
Nisha is a marketing manager and former Amazon seller who writes about e-commerce growth, consumer behavior, and digital retail trends.